Analytics Without Cookies: How I Track Visitors on My Own Website
I stopped relying on third-party trackers and built my own analytics dashboard. It uses no cookies, never stores IP addresses, and still shows visitors, sessions, traffic sources, devices and even a map of where readers are.

· 5 min read
Most websites measure their visitors by handing every browser a tracking cookie and sending the details to a company they do not control. For my own site I wanted the opposite: numbers I can trust, stored on my own server, collected in a way I would be comfortable explaining to any visitor.
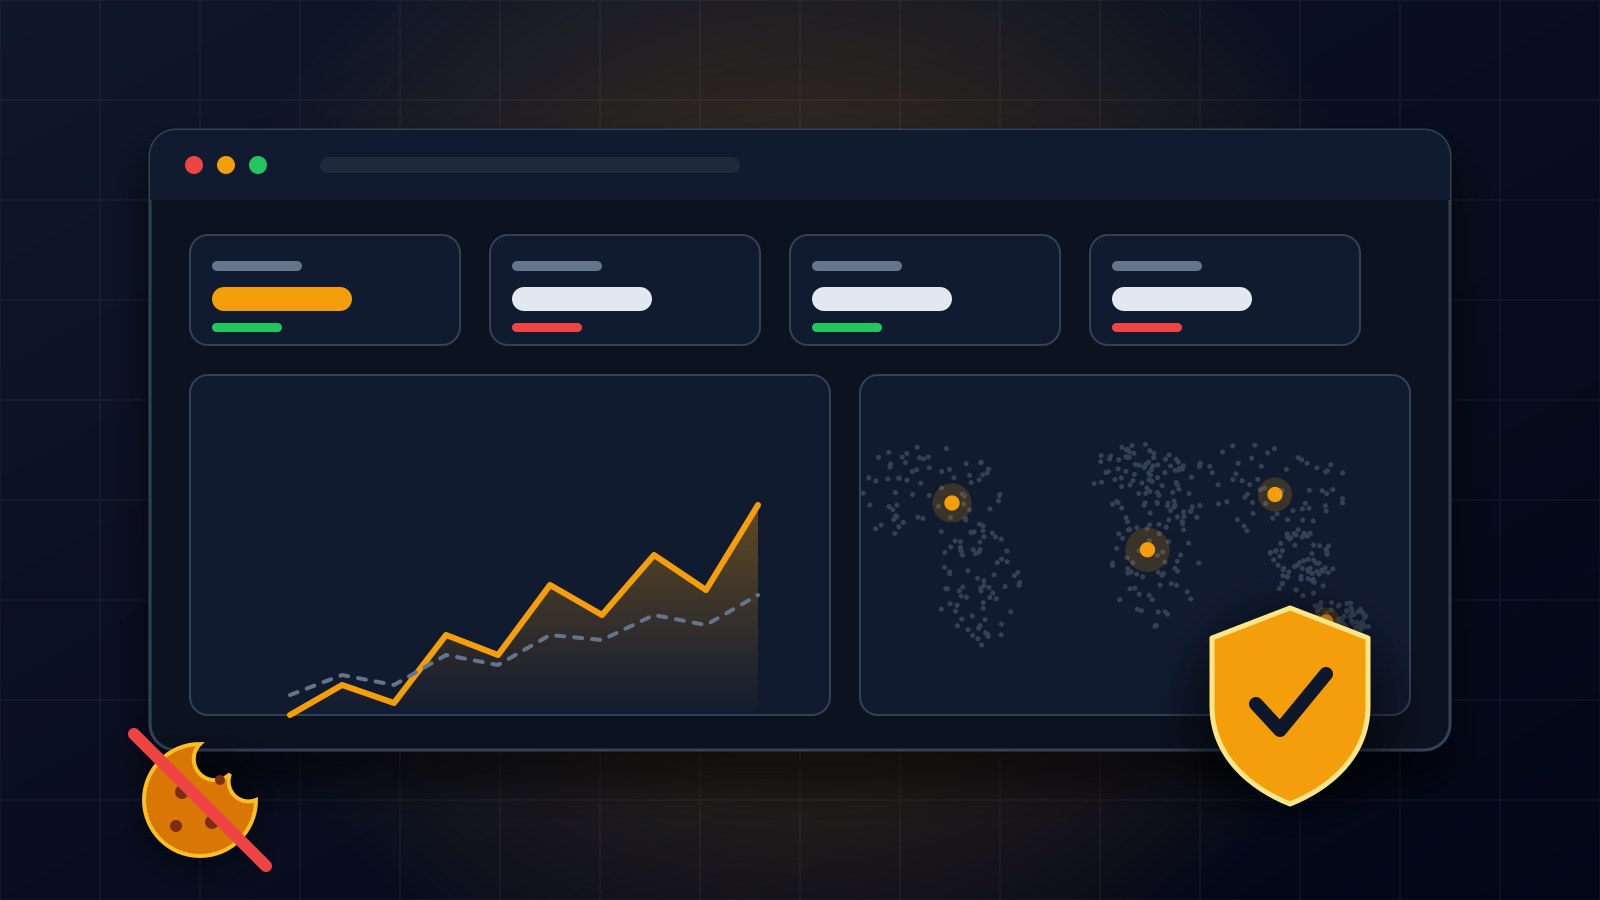
So I built my own analytics dashboard inside the admin panel of francislandford.com. It looks and feels like the dashboards people already know, but it does not use cookies, it does not keep IP addresses, and it does not send anything to anyone else. This post explains how it works and where its numbers should not be over-trusted.
Why not just use a ready-made tracker
Ready-made trackers are convenient, but they come with costs. They add scripts that slow pages down, they often need a cookie banner, and the data lives on someone else's servers. Many visitors also block them, which quietly makes the numbers smaller than reality.
For a portfolio and blog, I do not need to follow anyone around the internet. I only need to answer simple questions. How many people visited? Which pages did they read? Where did they come from? A small amount of carefully chosen data answers all of that.
What gets recorded
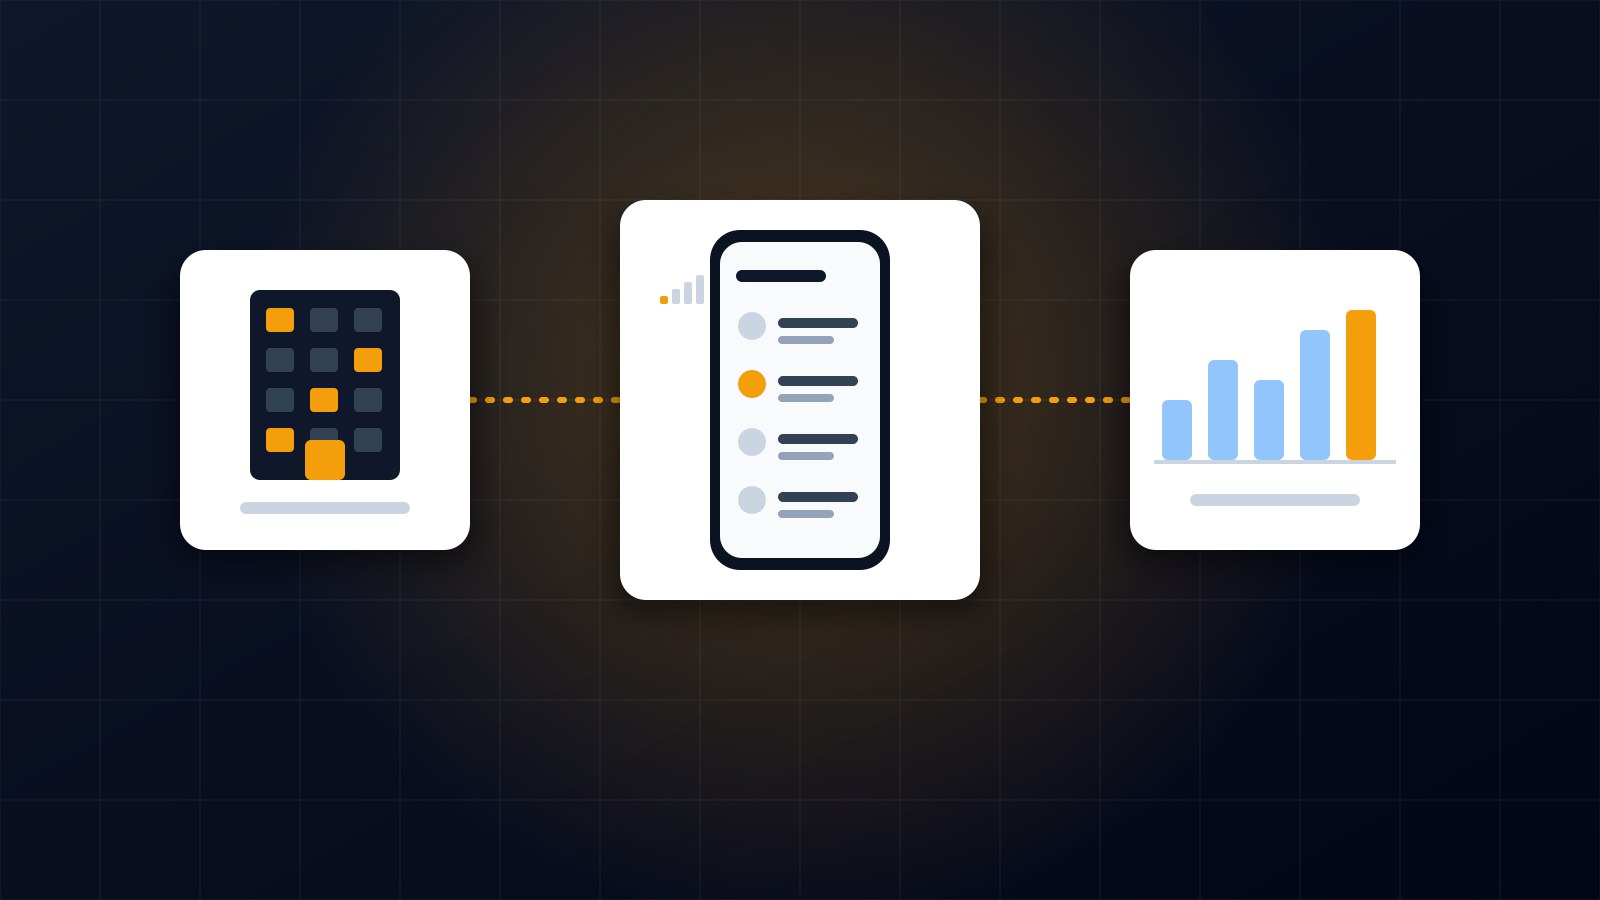
Every time a real person opens a public page, the server writes one small row: the page address, the page they came from, the time, a short device description, and an approximate location. That is all.
Because this happens on the server while the page is being delivered, it needs no tracking script in the browser. Search engine crawlers, link checkers and other robots are filtered out so they do not inflate the counts.
Counting visitors without cookies
The hard part of cookie-free analytics is telling visitors apart. My approach is to create a one-way fingerprint from the visitor's connection details and the current date, then scramble it so it cannot be reversed. The scrambled value is what gets stored. The original details are never saved.
This has a deliberate side effect. Because the date is part of the fingerprint, the same person looks like a new visitor each day. That means I cannot follow anyone across days, which is exactly the point. It also means a returning reader counts once per day, not once ever, so I treat visitor numbers as daily visitors.
Sessions and time on site
A session is a visit made up of one or more page views. I group views from the same visitor into one session and start a new session after thirty minutes of inactivity, which is the same rule many well-known tools use.
From sessions I can work out useful numbers: how many pages a visit includes, how long visits last, and what share of visits looked at more than one page. The time on site is an estimate, because a server only knows when pages were requested, not when someone stopped reading.
Where visitors come from
I sort each visit into a channel using the page that sent the person: search engines, social networks, other websites, email links, or direct visits with no referrer. Having this next to the page rankings tells me quickly whether a blog post is being found through search or shared by people.
Devices and browsers
The device description is enough to tell whether a visit came from a phone, a tablet or a computer, and which browser and operating system it used. This matters for design decisions. If most readers are on phones, the mobile layout is the real website, and I should test it first.
Adding the map
The latest addition is geography. For each visit, the server looks the connection up in a location database that is stored on my own server. It keeps only the country, the region and the city, and throws the address away immediately. Nothing is sent to an outside service while doing this.
The dashboard then shows a world map shaded by how many visits came from each country, with lists of the top countries and cities beside it. It is a good way to see whether the content is reaching the people it was written for.
What the numbers can and cannot tell you
I want to be honest about the limits, because analytics are often treated as more certain than they are.
Location from a connection address is approximate. Countries are usually right. Cities can be off, especially on mobile networks, where the address may belong to a provider's hub in a different town. Someone using a VPN appears wherever the VPN is.
Visitor counts are per day, not per person. Time on site is an estimate. And the map only knows about visits made after it was switched on, because the old data never stored a place.
Even so, the trends are reliable. A page that doubles its views, a new source of traffic or a growing audience in a new country all show up clearly, and those are the things that guide what I write and build next.
If you are building your own
Decide what questions you actually need answered, and collect only the data that answers them. Store a scrambled value instead of anything that identifies a person. Do the work on your own server so no one else gets a copy. Be clear about the limits, and credit the data sources you rely on.
If you would like a dashboard like this for your own website or business, get in touch through the contact page.
About the author
Francis Landford
Software Engineer | Creative Problem Solver | Innovative Software Solutions & Modern Applications
More about Francis Landford →